Intuit Expert onboarding funnel.
How I designed a 0-1 onboarding funnel that took expert readiness from 68% to 99% across 40,000 experts in a single tax season.
Impact and what I shipped
Expert readiness
68% → 99%
Readiness conversion across a pipeline of 40,000 experts in a single tax season
Tracking
5 → 1
Disconnected systems consolidated into one unified funnel — 40,000 candidates tracked for the first time
Work reduction
100%
Manual data reconciliation eliminated across Quickbase, ALM, Google Sheets, and team meeting relays
Holistic platform
2+ hrs
Of mid-season downtime removed — the single point of failure that took 50 CX managers offline
The problem space
Every tax season, Intuit needs 40,000 experts to serve its customers. Expert onboarding was broken, disconnected, and only reached 68% of hiring goals with enormous amounts of manual work.
Intuit had already lost 27-37% of its expert workforce in a single season, with no reliable data on where in the lifecycle they were dropping off or why. Attrition was being tracked through personal emails, manual Quickbase entries, and verbal reports, making it nearly impossible to intervene before it was too late.
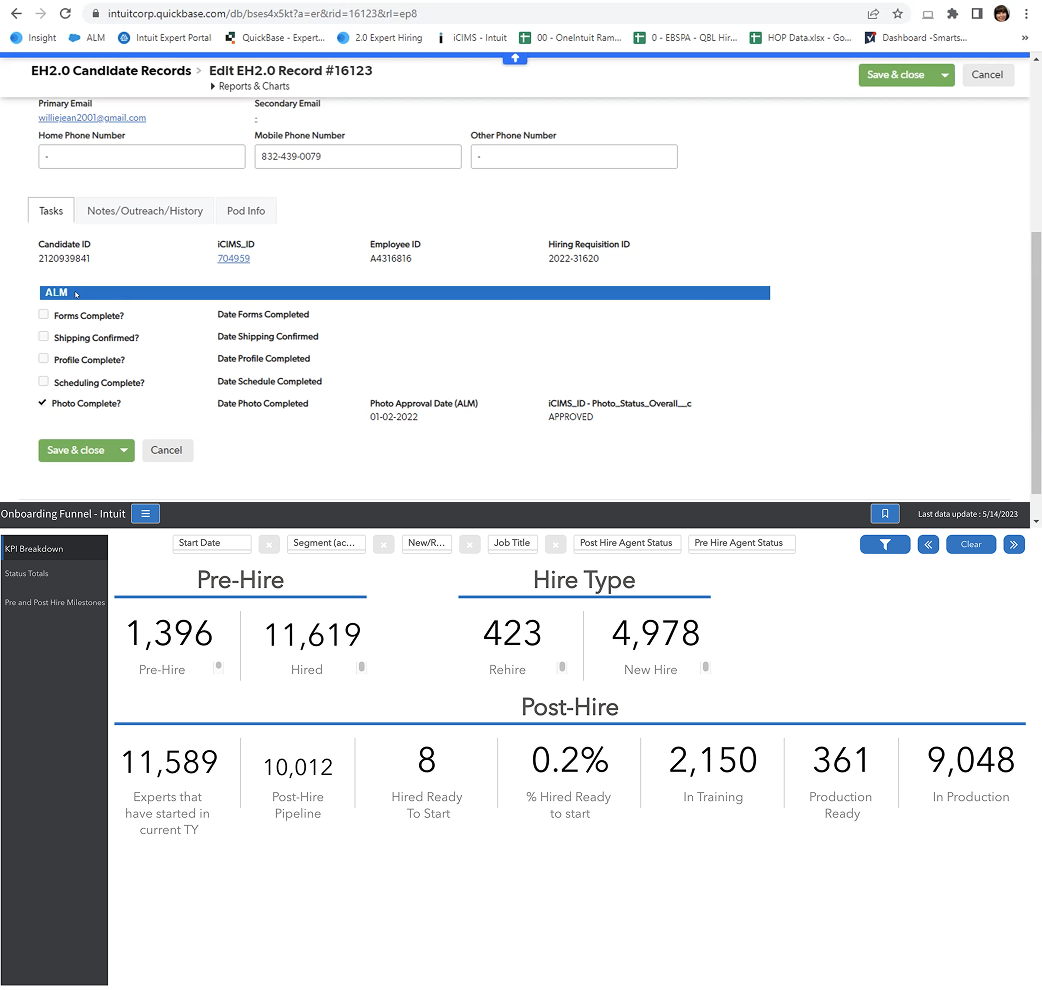
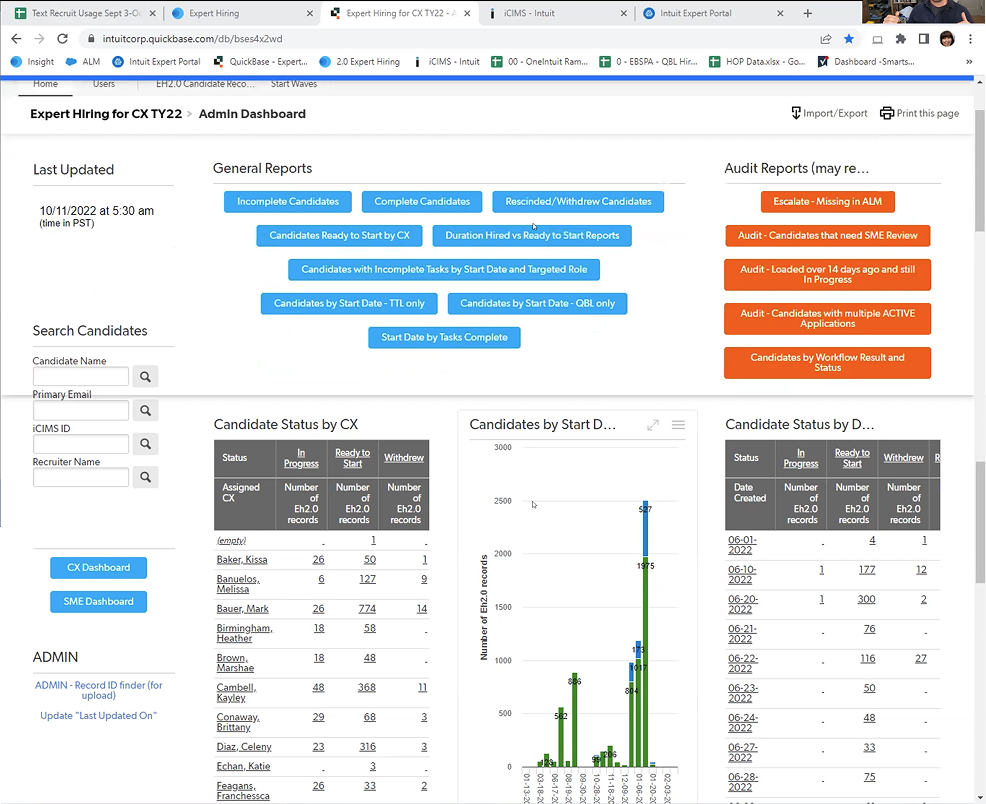
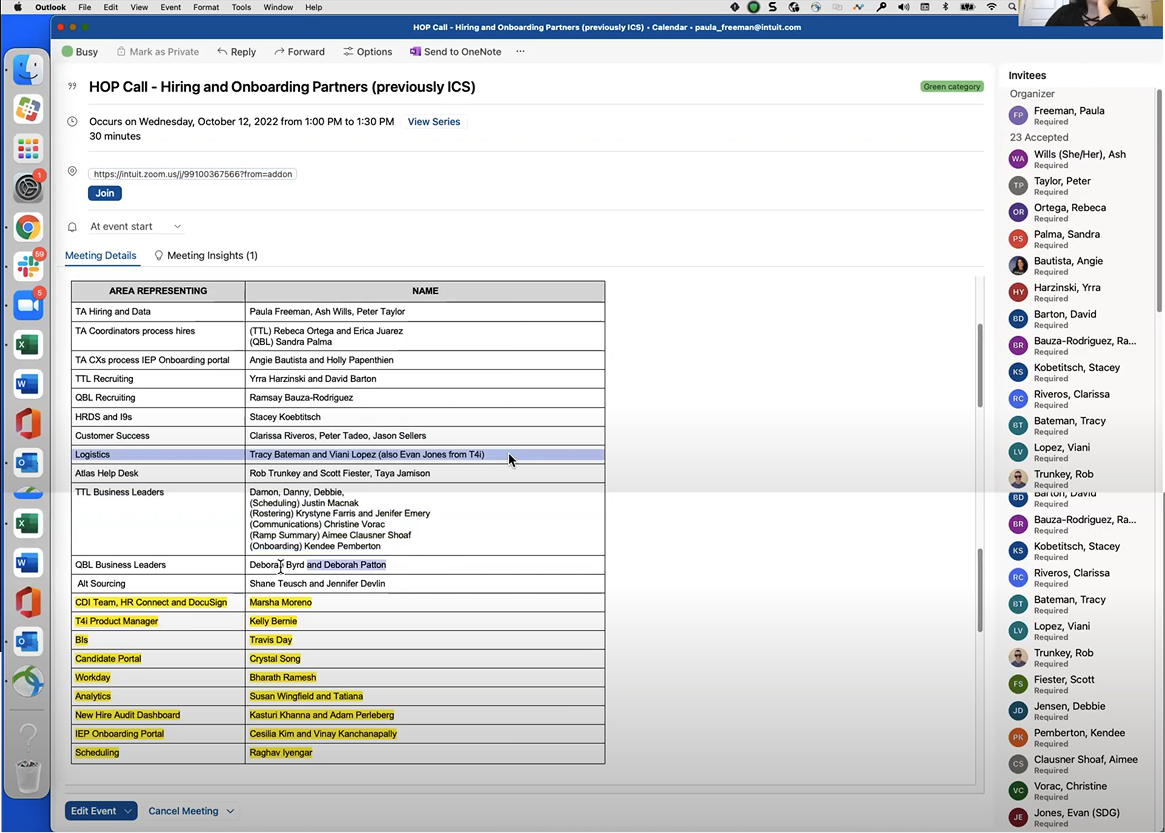
Data lived across five disconnected systems with no API integration and no single team owned the end-to-end process. ICIMS and EH 2.0 held hiring data not connected to onboarding. Quickbase had no enterprise support and was a single point of failure. ALM and Workday held onboarding data siloed from hiring. Google Sheets tracked headcount manually. No single owner existed for the end-to-end process.
Previous experience
The fragmented current state: five systems, no integration, manual data transfer at every step
Candidate information is collected from EH 2.0 by copying the ALM files and creating a clone and then moving that information into a Quickbase
Going broad and going narrow
Mapping the full problem and opportunity space before defining the solution
The initial brief centered on two connected problems: Intuit had already lost 27-37% of its expert workforce in a single season with no reliable data on where in the lifecycle they were dropping off or why. Rather than jumping straight to solutions I mapped out the full problem and opportunity space first, identifying every area where the expert lifecycle could be breaking down, from hiring data fragmentation to scheduling visibility to attrition tracking.
The goal was to go as wide as possible before narrowing, so we weren't solving for the loudest complaint while missing the actual root cause.
Where I focused and why
Opportunity spaces
Attrition prevention
27-37% of experts lost per season with no visibility into why. Real-time tracking creates the ability to intervene before drop-off
Scheduling visibility
40,000 expert schedules with no aggregate view. A single hours dashboard eliminates manual calendar reviews and surfaces gaps instantly
Data accuracy
EH 2.0 and Quickbase perpetually out of sync. A single source of truth with 15-minute refresh turns reactive decisions into proactive ones
End-to-end ownership
Five systems across five teams with no single owner. One platform creates accountability and a clear operational backbone for the first time
Conversion uplift
32% gap between hired and ready-to-serve experts. Closing it directly unlocks seasonal capacity goals
Solutions
 123
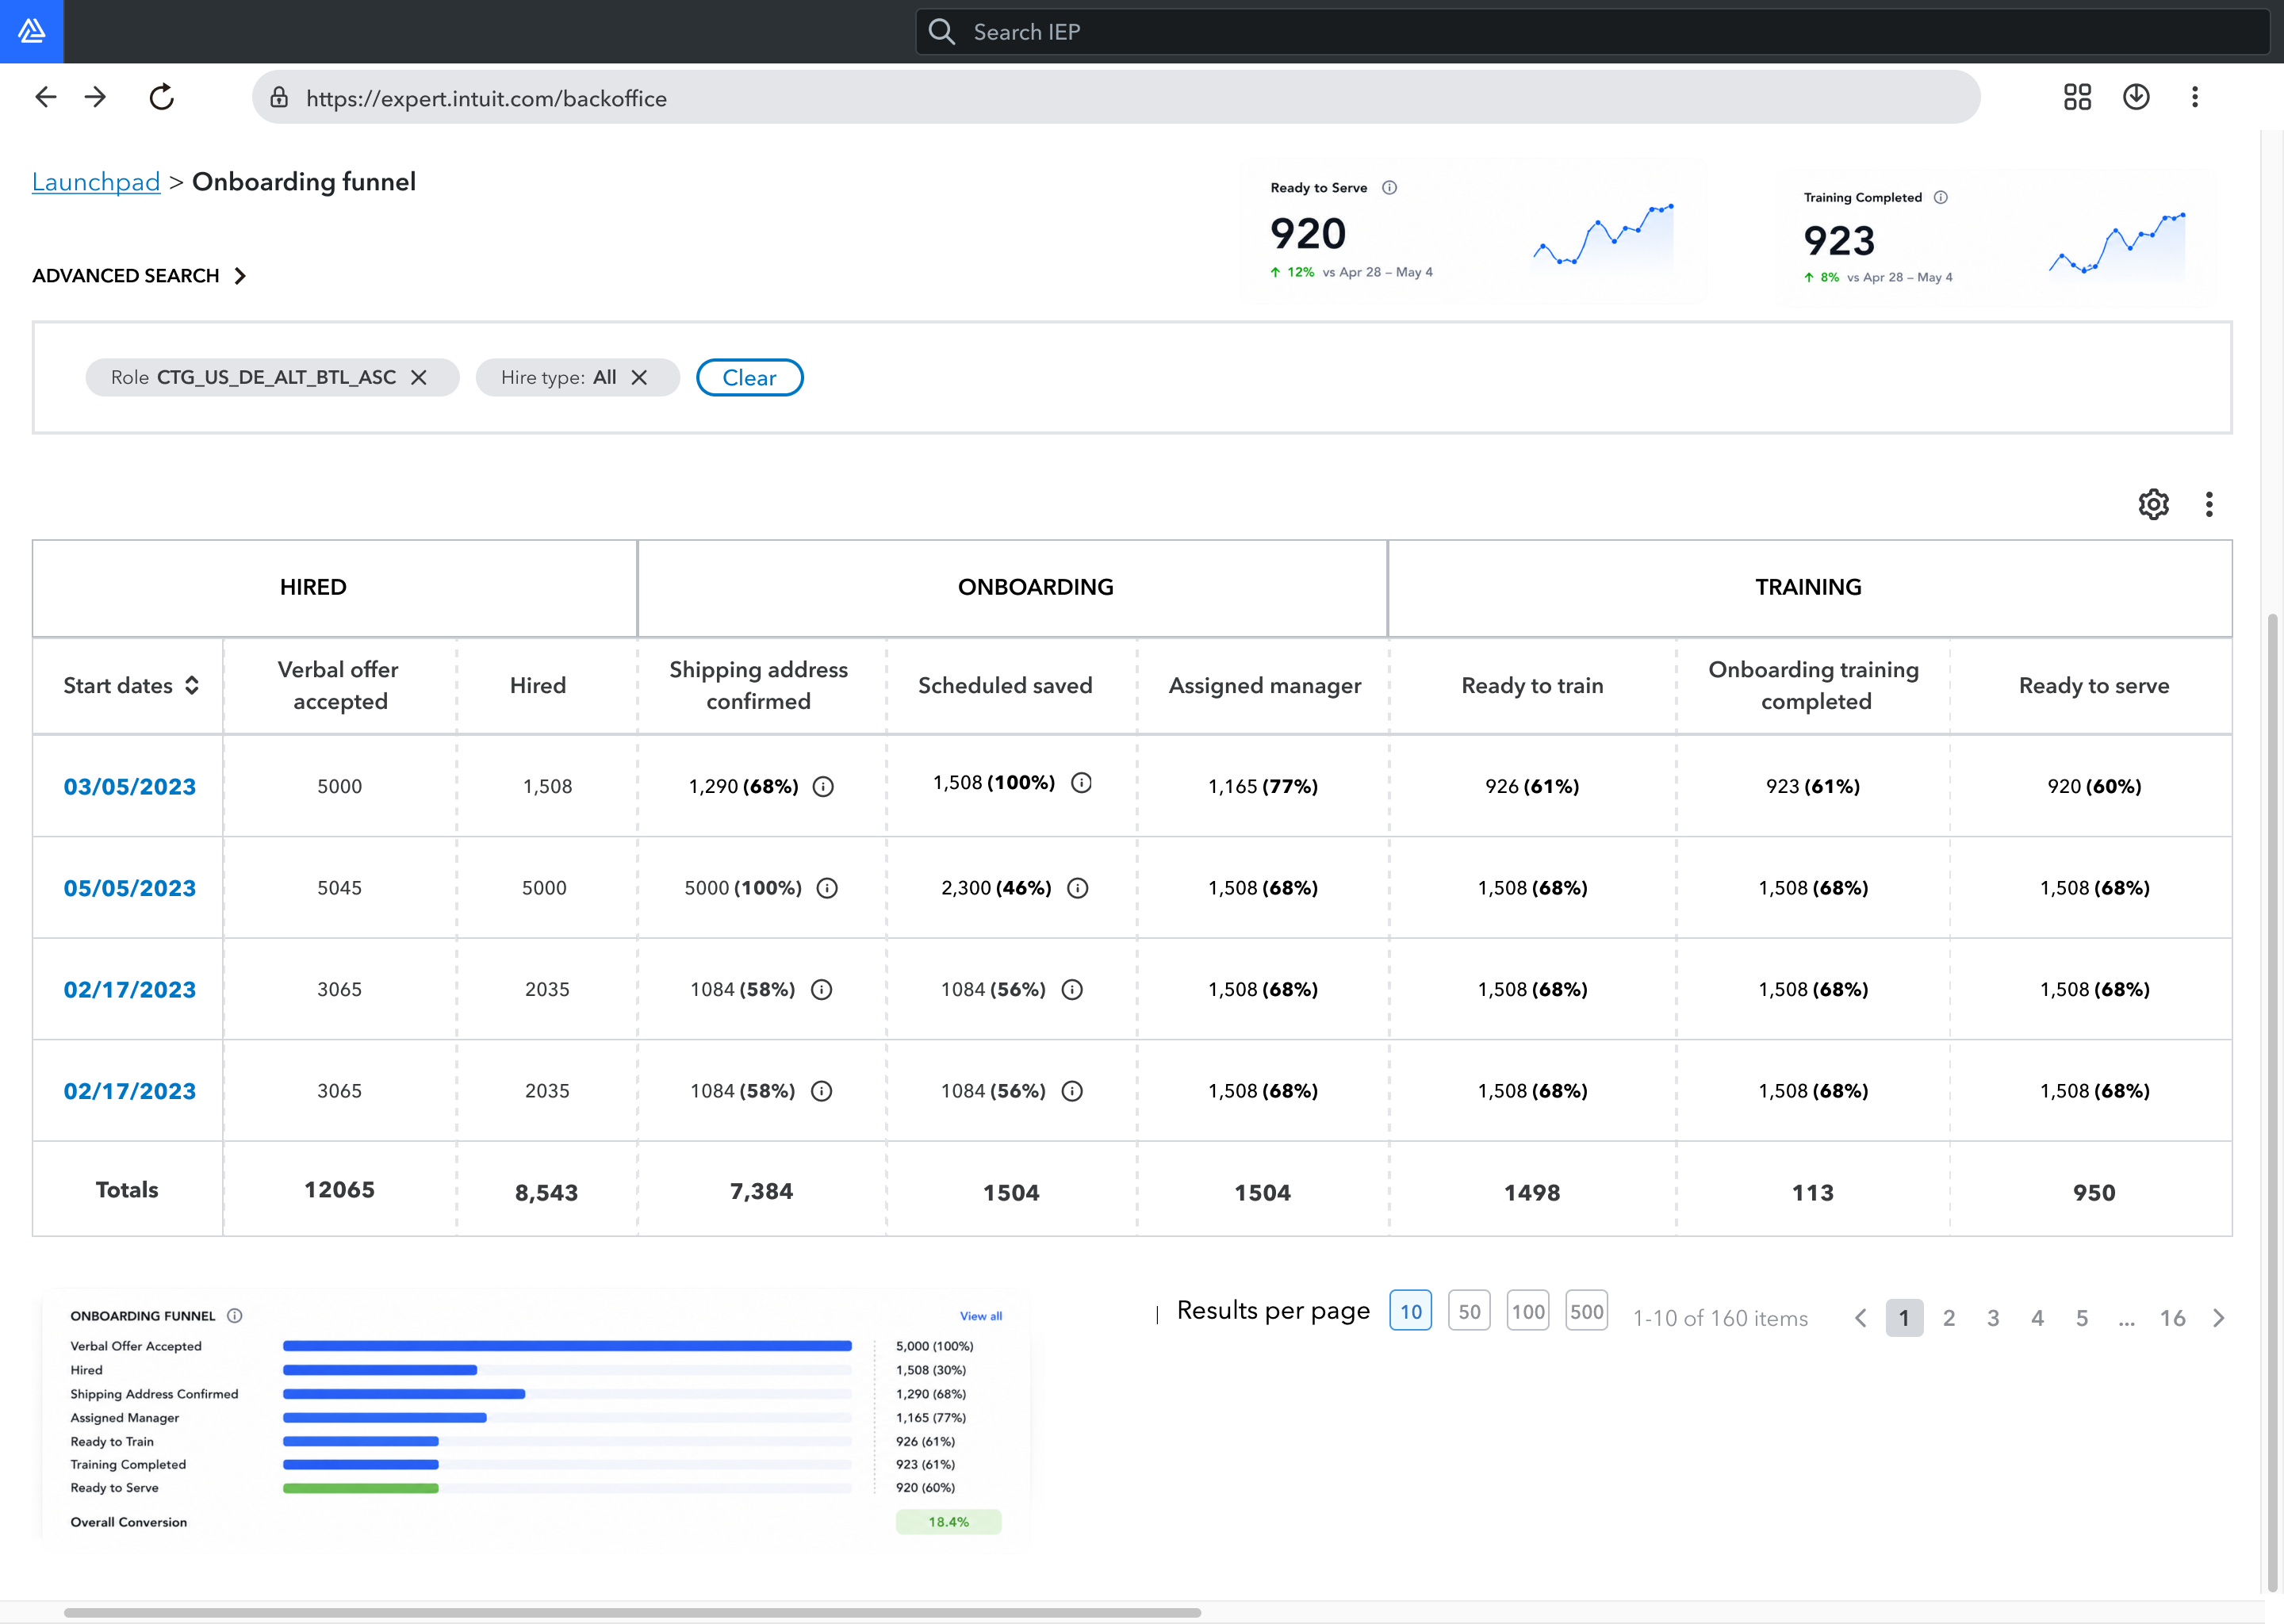
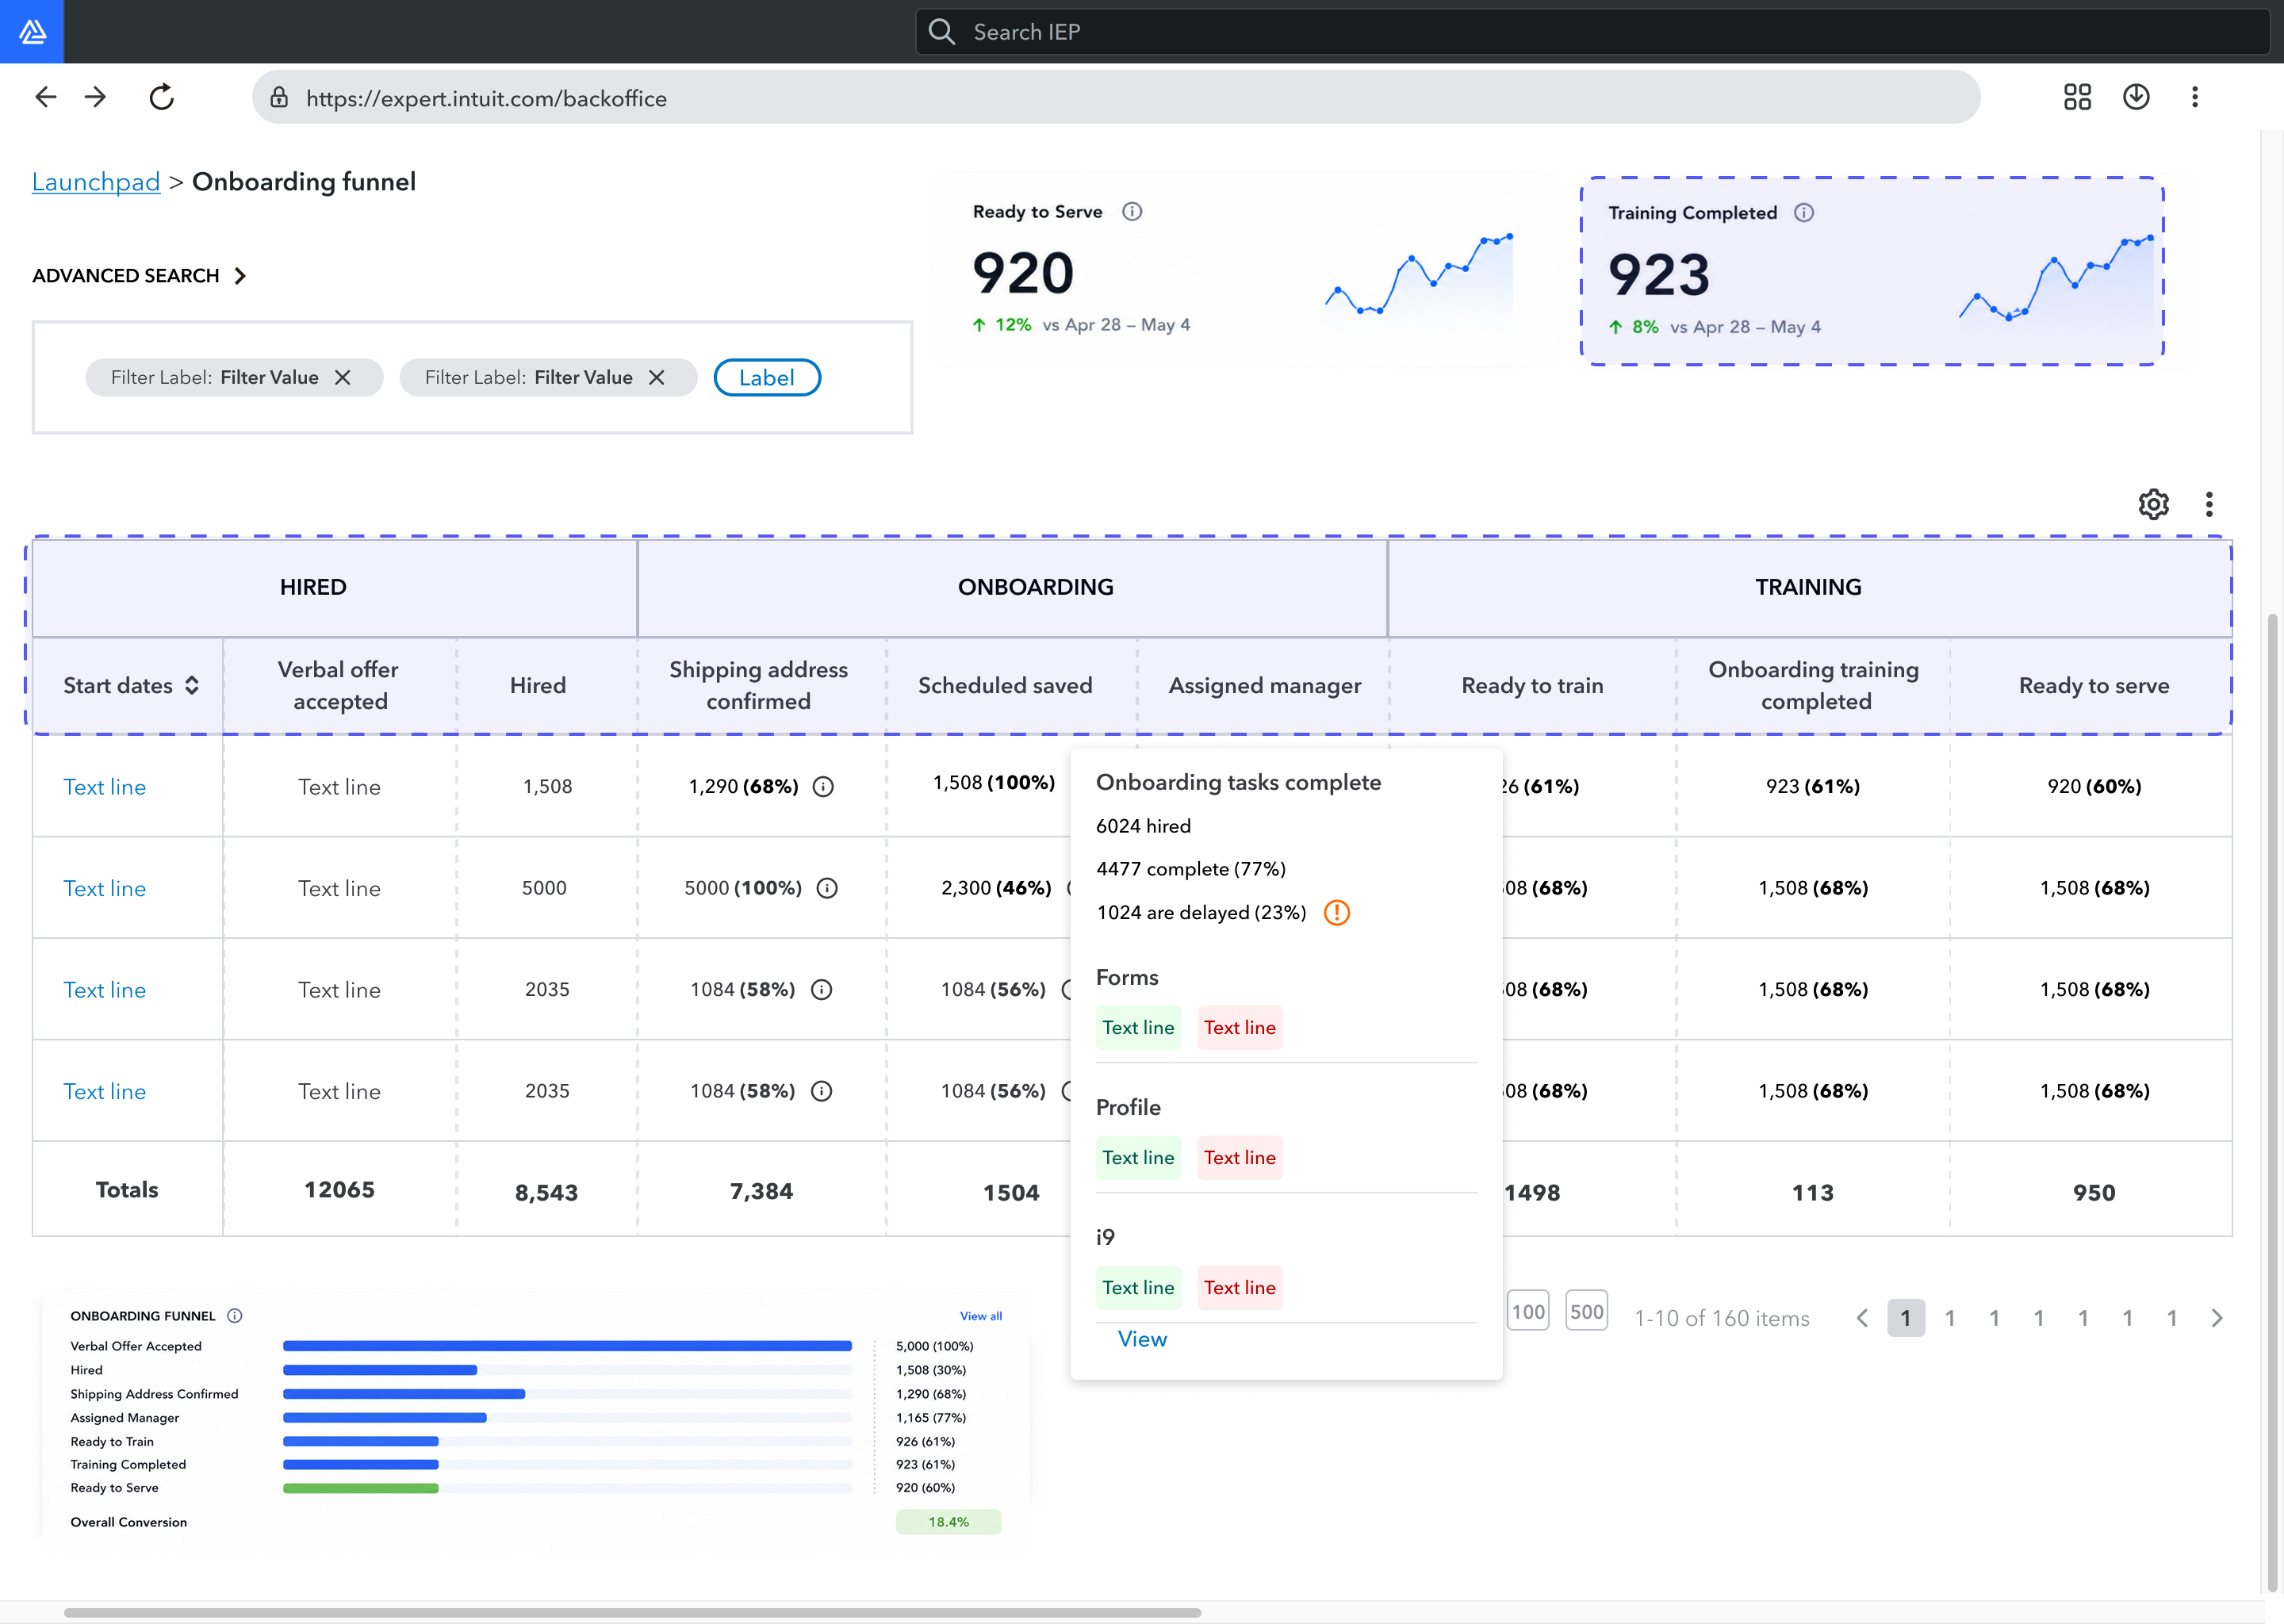
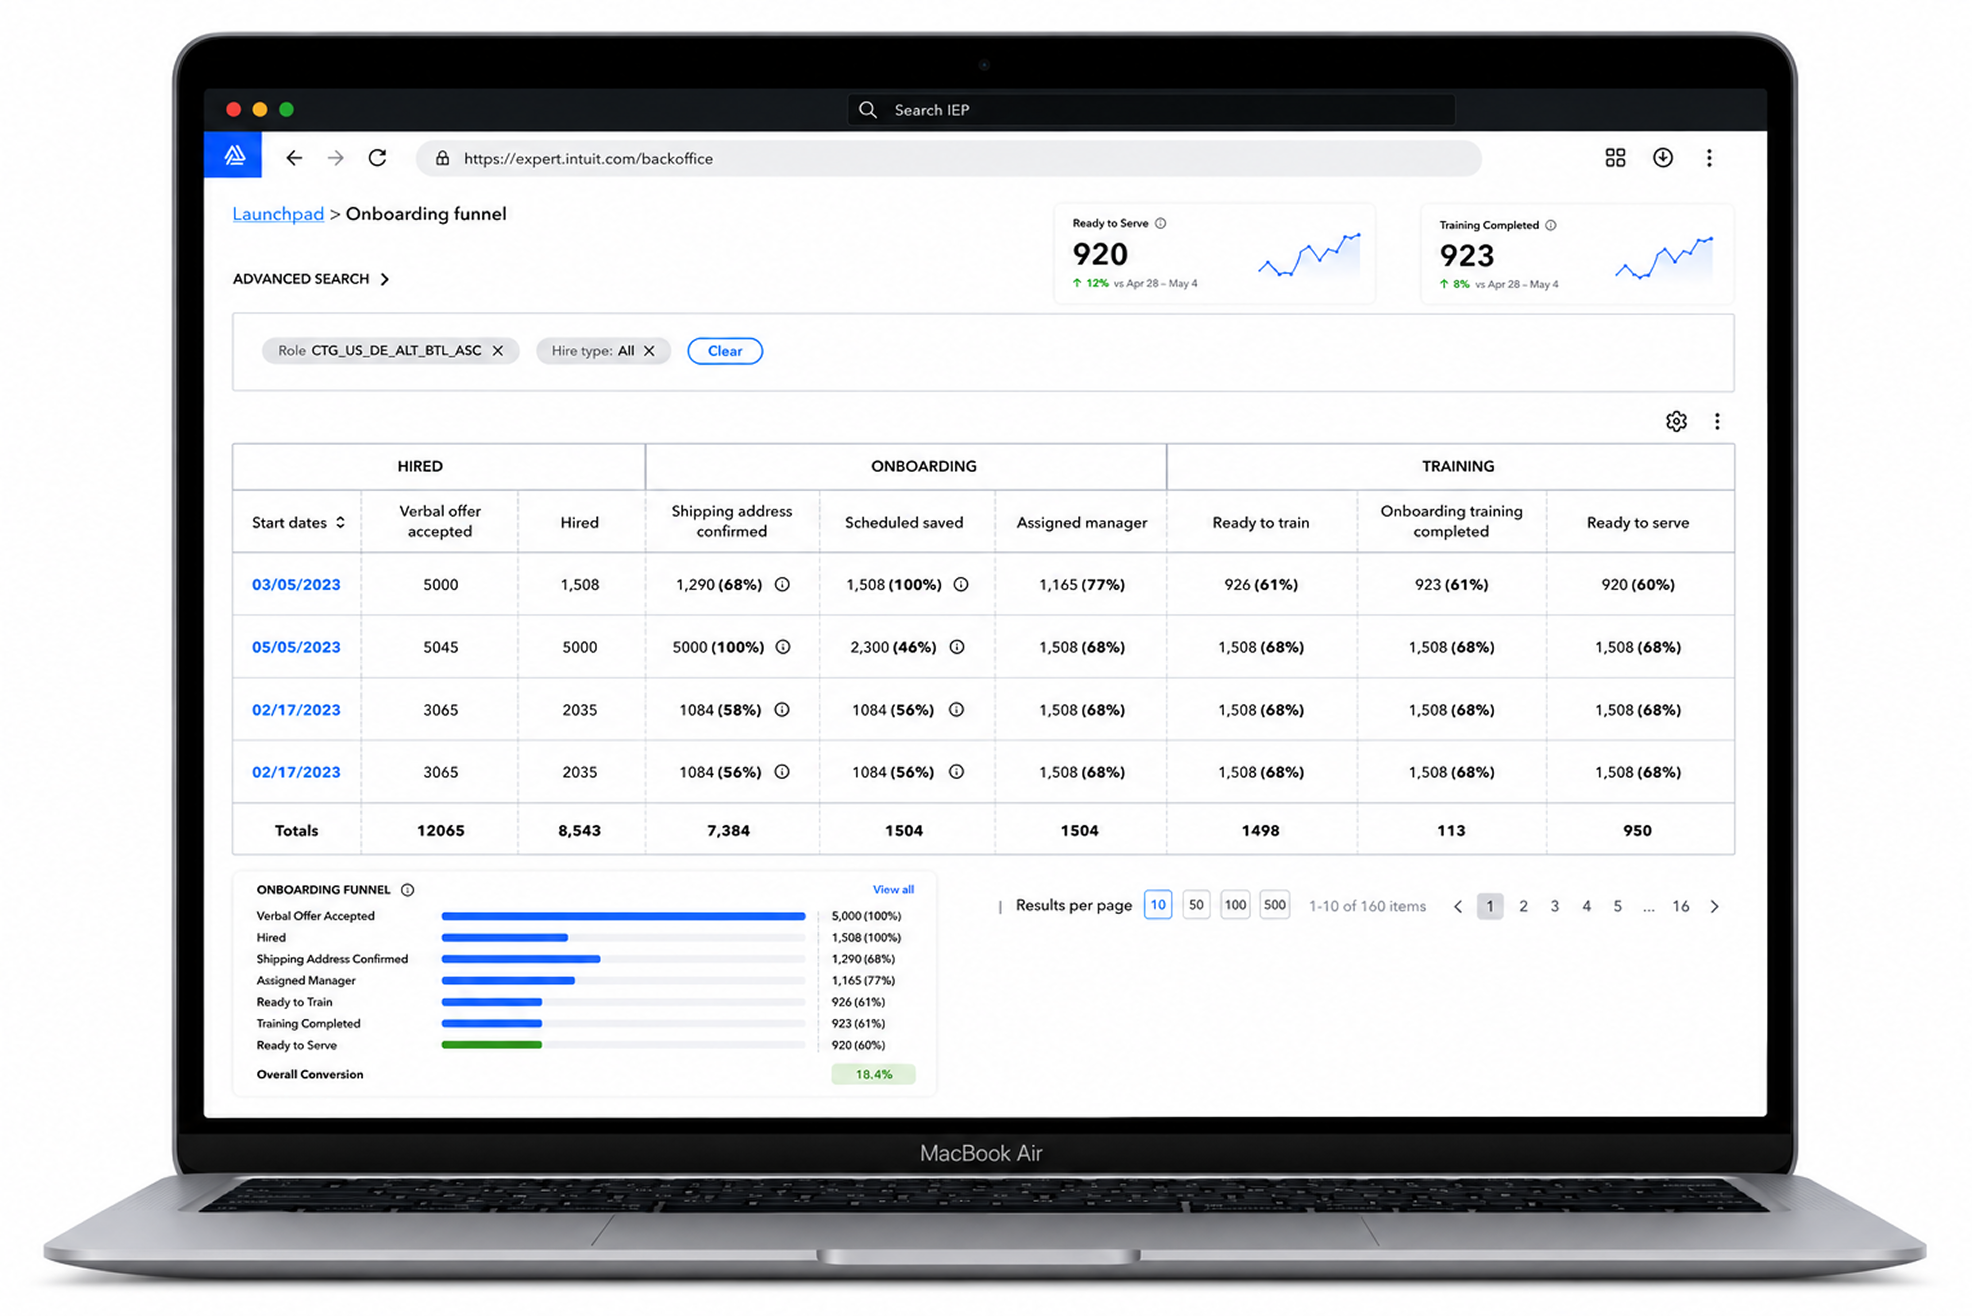
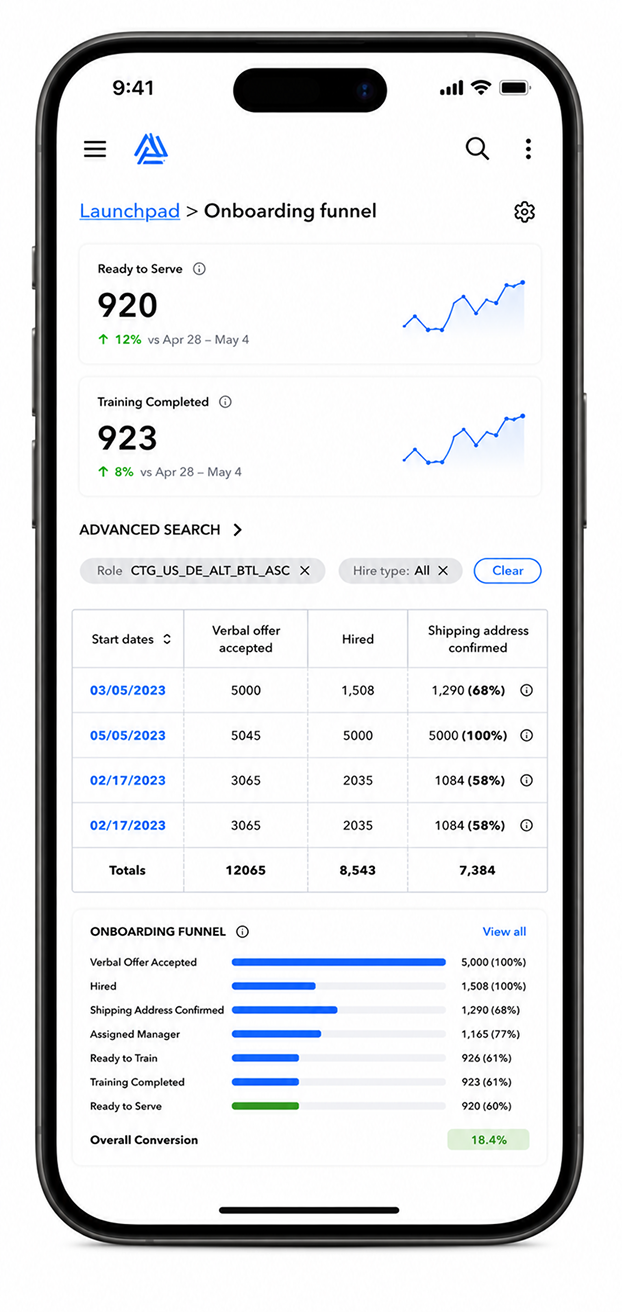
123End-to-end milestone tracking broken down by hiring wave and start date. Each column represents a milestone: verbal offer, hired, shipping confirmed, scheduled, assigned manager, ready to train, training completed, ready to serve. Previously this lived across five systems reconciled manually in Google Sheets after team meetings. Now every wave and every milestone is visible in one place, updated in real time.
Hovering over any milestone cell reveals a real-time breakdown of exactly where experts are stalling within that stage. Forms, Profile, and i9 completion rates are shown instantly, with incomplete counts flagged in red. Previously operators had no visibility into which specific task was blocking an expert, they only knew something was wrong after it was too late to intervene. This turned a black box into an actionable drill-down.
Previously these numbers had to be manually pulled from Quickbase and were always stale by the time they reached operators. Now updated automatically, giving managers an at-a-glance read on network health against seasonal capacity goals.
Parity views
Vision and design principles
As wireframing began, three principles kept surfacing organically across every design decision, not defined upfront but emerging from the work itself. Transparent meant every operator should see the full network picture, not just their slice, which showed up in cross-wave funnel views and network-wide milestone tracking. Actionable meant data alone wasn't enough, every view needed to point operators toward what to do next, surfacing which experts were stalling and where to intervene before attrition happened.
Personalized meant the system had to flex between a network-level M2 manager and an intraday operator, with filterable views by wave, role, segment, and hire type so every manager saw exactly what was relevant to their scope. Those three principles became the north star for everything that followed: "Every expert who commits to Intuit feels seen, supported, and set up to succeed, and every manager has the clarity to make that happen."
Transparent
Personalized
Actionable
Impact and what I shipped
Expert readiness
68% → 99%
Readiness conversion across a pipeline of 40,000 experts in a single tax season
Tracking
5 → 1
Disconnected systems consolidated into one unified funnel — 40,000 candidates tracked for the first time
Work reduction
100%
Manual data reconciliation eliminated across Quickbase, ALM, Google Sheets, and team meeting relays
Holistic platform
2+ hrs
Of mid-season downtime removed — the single point of failure that took 50 CX managers offline